
A VS Code extension for visualizing data structures while debugging.
Works best with JavaScript/TypeScript. Also tested with C#, Java and PHP. Works with any language that you can debug in VS Code.

After installing this extension, use the command Open a new Debug Visualizer View to open a new visualizer view.
In this view you can enter an expression that is evaluated and visualized while stepping through your application.
You can refresh the evaluation and pop out the current visualizer view into a new browser window by using the top right buttons. You can also unfold the details pane to select a Data Extractor and a Visualizer.
Visualizers consume specific JSON data. See Integrated Visualizers for the schema of supported JSON data.
The currently visualized expression should evaluate to a JSON Object string,
matching the schema of one of the supported visualizers. This JSON string may be surrounded by single or double quotation marks (or none at all) and must not be escaped.
A valid example is "{ "kind": { "text": true }, "text": "some text\nmore text" }".
For some languages (TypeScript/JavaScript), runtime code is injected to support Data Extractors. A Data Extractor lifts the requirement for the visualized value to be a JSON string and acts as a bridge between custom data structures and the JSON data processed by the visualizers. When multiple Data Extractors are applicable, a preferred one can be selected in the visualization view.
The following visualizers are built into this extension.
The Graphviz and vis.js visualizers render data that matches the Graph interface.
interface Graph {
	kind: { graph: true };
	nodes: NodeGraphData[];
	edges: EdgeGraphData[];
}

interface NodeGraphData {
	id: string;
	label?: string;
	color?: string;
	shape?: "ellipse" | "box";
}

interface EdgeGraphData {
	from: string;
	to: string;
	label?: string;
	id?: string;
	color?: string;
	dashes?: boolean;
}
The graphviz visualizer uses the SVG viewer to render the SVG created by viz.js.


The plotly visualizer uses plotly and can visualize JSON data matching the following interface:
export interface Plotly {
	kind: { plotly: true };
	data: Partial<Plotly.Data>[];
}
// See plotly docs for Plotly.Data.
The tree visualizer renders data that matches the Tree interface.
interface Tree<TData = unknown> {
	kind: { tree: true };
	root: TreeNode<TData>;
}
interface TreeNode<TExtraData> {
	id: string | undefined;
	name: string;
	value: string | undefined;
	emphasizedValue: string | undefined;
	children: TreeNode<TExtraData>[];
	data: TExtraData;
	isMarked: boolean;
}
The AST (Abstract Syntax Tree) visualizer renders data that matches the Ast interface.
interface Ast
	extends Tree<{
			position: number;
			length: number;
		}>,
		Text {
	kind: { text: true; tree: true; ast: true };
}
Additionally to the tree view, the source code is rendered and when selecting an AST node, its span in the source code is highlighted.

Visualizes data matching the following interface:
export interface Grid {
	kind: { array: true };
	columnLabels?: { label?: string }[];
	rows: {
		label?: string;
		columns: {
			content?: string;
			tag?: string;
			color?: string;
		}[];
	}[];
	markers?: {
		id: string;

		row: number;
		column: number;
		rows?: number;
		columns?: number;

		label?: string;
		color?: string;
	}[];
}
The text visualizer renders data that matches the Text interface.
interface Text {
	kind: { text: true };
	text: string;
	mimeType?: string;
	fileName?: string;
}
The mimeType and the file extension of fileName are used for syntax highlighting.
The SVG visualizer renders data that matches the Svg interface.
The actual SVG data must be stored in text.
interface Svg extends Text {
	kind: { text: true; svg: true };
}The Graphviz Dot visualizer renders data that matches the DotGraph interface.
interface DotGraph extends Text {
	kind: { text: true; dotGraph: true };
}
Viz.js (Graphviz) is used for rendering.
Data extractors convert arbitrary values into data consumable by visualizers.
They live in the debugee. The following data extractors are injected automatically into the debugee by this extension when using the node, node2, extensionHost or chrome debug adapter.
Custom data extractors can be registered too.
See the package @hediet/debug-visualizer-data-extraction and its README for the implementation and its API.
Also, a global object of name hedietDbgVis with helper functions is injected.
Just calls .toString() on values and treats the result as text.
- Direct Visualization of
ts.Nodes - Visualization of
Record<string, ts.Node>and[ts.Node]. If the record contains a keyfn, its value is displayed for each node.
Treats the data as direct input to the visualizer.
Calls .getDebugVisualization() on values and treats the result as direct input to the visualizer.
Uses plotly to plot an array of numbers.
Constructs a graph containing all objects reachable from object the expression evaluates to. Graph is constructed using a breadth search. Stops after 50 nodes.
Creates Grid visualization data for an array.
-
Multi-line Expressions: Press
shift+enterto add a new line andctrl+enterto evaluate the expression. When only having a single line,entersubmits the current expression, but when having multiple lines,enterinserts another line break.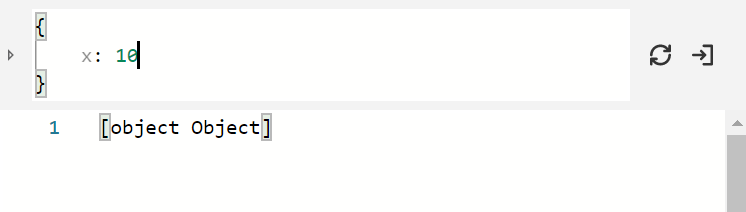

This extension works very well together with my library @hediet/node-reload for TypeScript/JavaScript.
Together, they provide an interactive playground.

Feel free to ping me on GitHub by opening an issue! Having runtime infrastructures for languages other than JavaScript would be awesome and I happily accept PRs!